Trusted by industrial leaders · selected insulation cases →
Free calculators, live carbon prices and open data on 74,000+ industrial facilities worldwide — plus the modular removable insulation that captures the saving.
The same three steps behind every engagement — start free, online.
Free ASTM C680 calculators and open data on 74,000+ facilities pinpoint where heat — and money — leaks. On site we bring the thermal camera.
Convert kW into € and tonnes of CO₂ at live ETS & CBAM rates, then turn it into SECR / CSRD report lines.
Fit removable insulation over the hot geometry — up to 96% less loss, touch-safe ≤45°C, refits after every maintenance cycle.
Every tool is free and uses the same ASTM C680 method as our engineering surveys.
Wrap complex geometry with removable panels — up to 96% less heat loss, touch-safe ≤45 °C, and 6× faster maintenance access vs standard insulation jackets and metal cladding/boxes.
Valve, pump & boiler insulation ROI · power-plant & whole-plant heat loss · carbon & CBAM. Plus a first-of-its-kind interactive 3D heat explorer: see exactly where heat escapes, bare vs insulated, with live ROI, € and CO₂ per component — we model your real equipment in 3D, from a single valve to a full machine line.
What CO₂ costs in 55 countries — live ETS price, CBAM, the 2026–2034 cliff. Price your own bill with the online calculators and export prices & countries as CSV or PDF.
SECR, CSRD/ESRS E1, ESOS & tender plans — plus the Carbon Savings Certificate that turns kW into report-ready lines you can download as CSV or signed PDF.
42,000+ power plants — not a flat list: owner portfolios, grid-mix context and "dirtiest in your country" rankings. Open data, CC BY.
29,681 industrial sites — not a flat list: operator portfolios, per-sector emitter rankings and CO₂ intensity per plant.
Each sector runs the same chain with its own data behind it.
Interactive brewery heat-loss map + 2,700 breweries + brewing ESG profile.
Correct heat-rate calculator — turbine, boiler and balance-of-plant all modelled — plus a 42,000-plant database (capacity, fuel, owner, CO₂).
CBAM calculators, 23 industry decarbonization pathways and emitter rankings.
ESG reporting profiles for every heat-using sector.
Anyone can audit heat loss. Anyone can sell insulation. Only Inzonex lets you see it in 3D.
Our interactive 3D explorers show exactly where heat escapes on a steam boiler — from hot doors and valves to the economizer — with FLIR-measured temperatures and live ROI, € and CO₂ per component. See it, price it, cut it: one chain, one supplier.
Open the steam-boiler 3D explorer →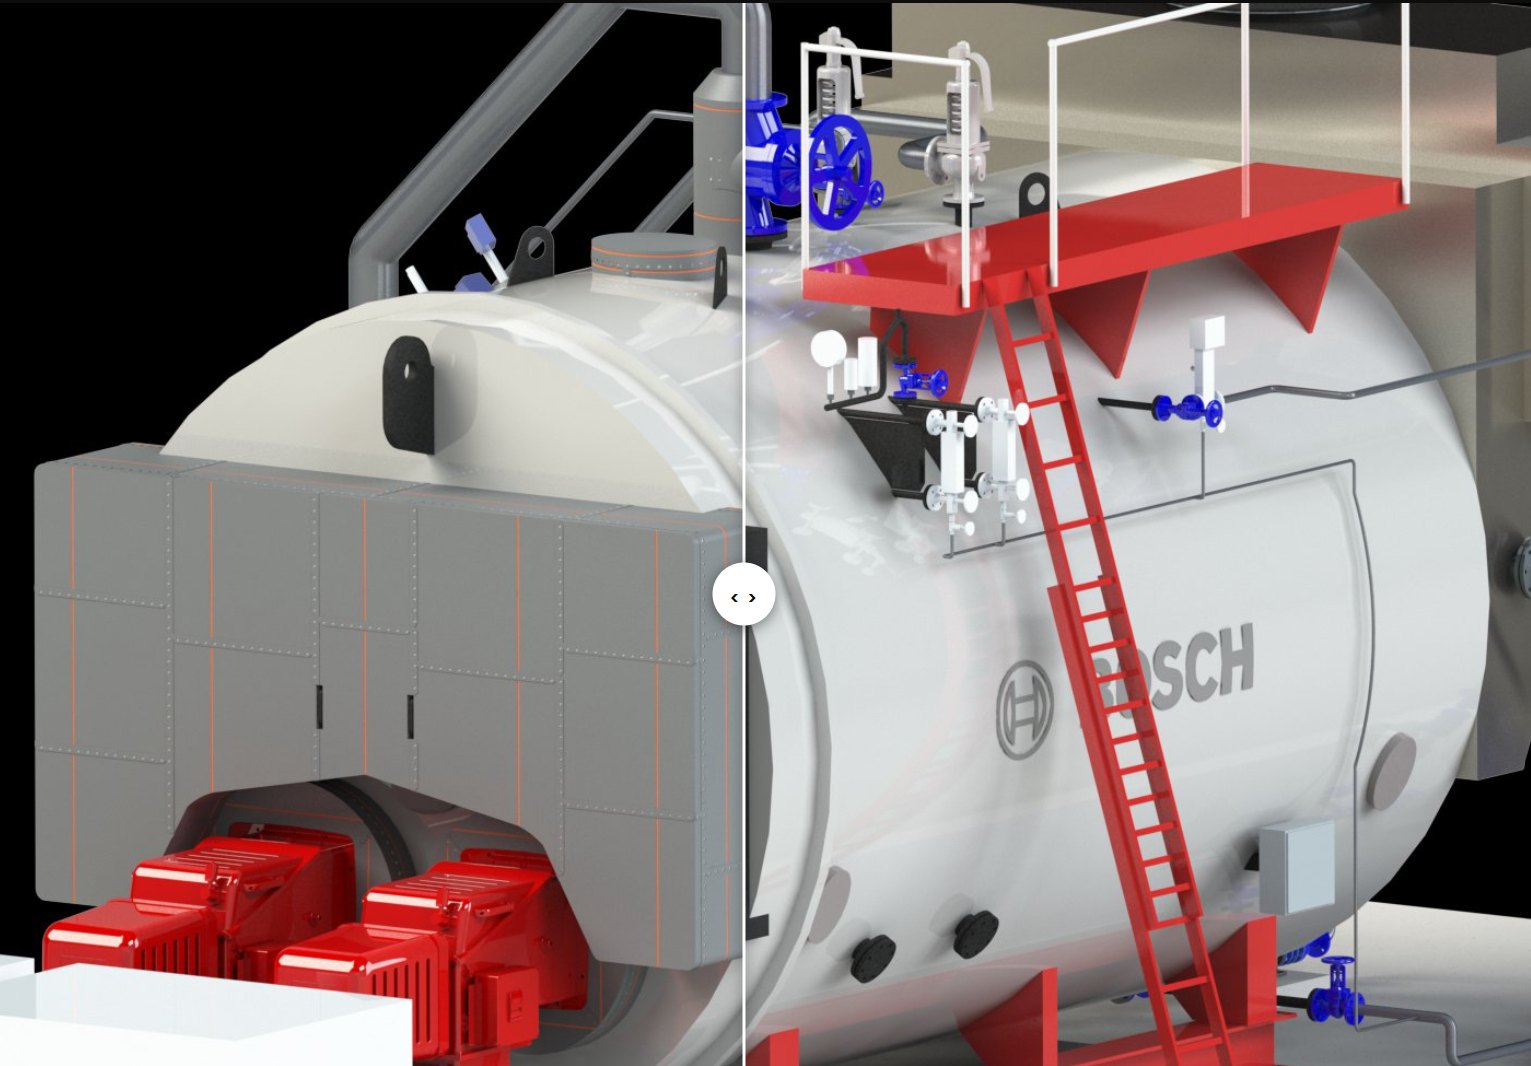
Valves, heat exchangers and pumps need access. Hard cladding is cut away once and left bare — our modular panels unclip and refit in minutes, every cycle.
Blankets and cladding skip the awkward shapes. Form-fit modular sections wrap valves, pumps and joints — the spots that leak most.
≤45 °C surfaces (EN ISO 13732-1) plus a Carbon Savings Certificate — the saving lands straight in your SECR / CSRD report.
Tell us your sector and what's losing heat. We send back a 3D before/after of your equipment and an interactive ROI — in €, kWh and CO₂. No call, no spreadsheet.
We've opened a pre-filled email to contact@inzonex.co.uk. Hit send and we'll reply with your 3D before/after and ROI.